Reducing disparities between Australian schools

In my recent Teacher article ‘Big five' challenges in school education I argue that one of the biggest challenges we face in school education is to reduce current disparities in the schooling experiences of students in Australia's most and least advantaged schools. The general challenge is to ensure that all students receive a high quality education, regardless of where they happen to live or the school that they happen to attend.
This is important because the evidence from the OECD's Programme for International Student Assessment (PISA) is not only that Australian literacy and numeracy levels at 15 years of age have been on a steady decline since the year 2000, but also that disparities between Australian secondary schools have been increasing over this time.[1] Schools in Australia have become increasingly different in their performances in PISA. Associated with this increasing disparity have been increasing differences in performance in low and high socioeconomic status schools.
The opposite has been true in some other countries. A number of countries have achieved significant improvements in national literacy and numeracy levels since 2000, and some countries – including Germany, Mexico and Turkey – have succeeded both in improving overall literacy and numeracy levels and in reducing disparities between schools related to socioeconomic background.
In Australia, evidence from a range of assessment programs reveals significant between-school disparities in student performance. These differences tend to be related to the socioeconomic contexts in which schools operate. For example, the following graph shows average Year 9 NAPLAN reading results for schools grouped according to the Index of Community Socio-Educational Advantage (ICSEA).[2] The national distribution of Year 9 student results in 2013 is on the right. The graph shows that students in these three ICSEA-based groupings of schools have different average reading levels and gives some indication of the influence of socioeconomic factors on between-school differences in student performance.[3]
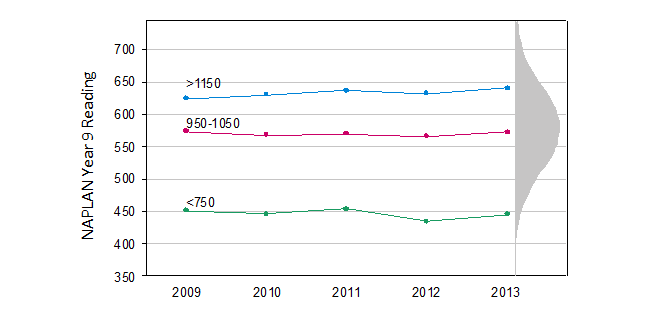
Figure 1. Average Year 9 reading results for schools in three ICSEA groups (2009 to 2013)
Of particular concern is the observation that, since 2000, between-school differences in student performance in PISA have been increasing. In other words, an increasing percentage of the variance in students' levels of performance in Australia is associated with the school they attend. In Finland, between-school variance is relatively low; how students perform is not much associated with the particular school they attend. At the other extreme, in countries that stream students into different kinds of secondary schools (for example, academic and vocational), between-school variance is much larger than in Australia.
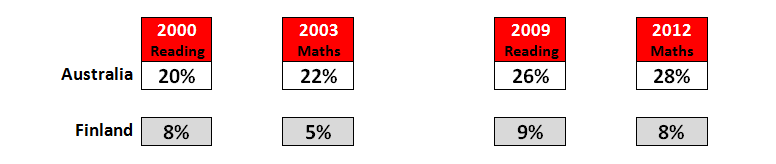
Figure 2. Between-school variance as a percentage of total variance (Australia and Finland)
The Australian percentages in Figure 2 may reflect greater between-school differences in mathematics than in reading. Nevertheless, significant increases occurred over these nine-year periods in both reading and mathematics.
A national key performance indicator (KPI)
A straightforward national indicator of disparities between Australian schools is the percentage of total variance in students' performances attributable to ‘between-school' differences (with the remaining variance being ‘within-school').
An immediate national objective should be to reverse the current trend of increasing disparities between Australian schools as reflected in PISA. A short-term objective should be to reduce between-school differences to levels that existed at the turn of the century. A long-term objective should be to make student outcomes still less dependent on which school they attend, the socioeconomic area in which they live, or school sector.
International experience shows that education policy decisions can either increase or reduce disparities between a nation's schools. For example, since the 1970s, Finland has implemented a comprehensive and fully publicly-funded school system which enrols all children regardless of their socioeconomic background or personal abilities and characteristics.[4] There are few private schools, but those that exist are given a government grant comparable to that for state schools and are prohibited from charging tuition fees or making selective admissions. At the other extreme, countries that have adopted policies to stream students into different kinds of secondary schools have created large between-school differences in student performance (between-school variance above 60 per cent). Recently, a number of countries have made policy changes in the face of evidence that overall national performance is associated with reduced disparities between schools.
Effective policies
Ensuring consistently high standards across schools is a formidable challenge for any school system. Some performance differences between schools may be related to the socioeconomic composition of the school's student population or other characteristics of the student body. School location may also explain differences between schools... Between-school differences in performance may also be related to the quality of the school or staff or to the education policies implemented in some schools and not in others.[5]
In OECD countries generally, a large percentage of between-school variation in student performance is ‘explained' by differences in students' and schools' socioeconomic circumstances. In Australia in 2012, 55 per cent of the observed between-school variance in PISA mathematics was associated with differences between schools in average socioeconomic background.
Although between-school differences in student performance are closely associated with socioeconomic status in all OECD countries, some countries have been more successful than others in reducing the impact of socioeconomic disadvantage. Explicit government policies to minimise impact are often at the heart of their success.
Policies for reducing between-school disparities include:
- minimising student residualisation
Disparities between a nation's schools are smallest when the student population is distributed evenly across all schools – for example, when lower performing students or students from poorer socioeconomic backgrounds are not concentrated in particular schools. Government policies are capable of both increasing disparities (for example, by creating different kinds of schools and streaming students by ability) and reducing disparities (for example, by limiting school fees and prohibiting selective admissions). What a government can realistically do to minimise residualisation will depend on the national context. The important point is that education policies can make a difference to levels of student residualisation and thus to between-school disparities in student outcomes. - maximising access to quality teachers and leaders
Disparities between a nation's schools also can be reduced by ensuring that high-quality teaching and school leadership are more equitably distributed across all schools. To the extent that the most effective teachers and school leaders are concentrated in particular schools, while other schools struggle to recruit and retain highly able teachers and leaders, between-school disparities in student performance are increased. In some education systems, it is not uncommon for less effective teachers and leaders to be moved over time into less ‘attractive' schools – usually those that face the biggest challenges and are most in need of high quality teaching and leadership. - promoting effective school improvement practices
Between-school disparities in student performance also are influenced by the extent to which some schools implement more effective day-to-day practices than others. Highly effective practices include creating a school culture of high expectations; setting an explicit and shared school improvement agenda; creating opportunities for teachers to collaborate in evaluating and improving their day-to-day teaching; providing professional learning focused on improved teaching practices; identifying and addressing the needs of individual learners; and monitoring student progress and providing feedback in forms that guide next steps in learning.[6] Education systems and governments are in strong positions to support all schools in their use of evidence-based practices of these kinds.
Overall levels of national expenditure on schools are generally not highly correlated with measures of student performance or equity. However, there is international evidence that how resources are used does make a difference. A conclusion of the OECD is that improvements in national literacy and numeracy levels tend to be associated with the more equitable distribution of resources across schools. When national resources are used to minimise student residualisation, to ensure that every school has access to high quality teaching and school leadership, and to promote the use of effective, evidence-based practices in every school, it is more likely that every student will receive a high quality education regardless of the school they attend.
[1] Ainley, J & Gebhardt, E (2013). Measure for Measure: A Review of Outcomes of School Education in Australia. Melbourne: Australian Council for Educational Research. http://research.acer.edu.au/ar_misc/15
[2] Bonnor, C & Shepherd, B (2014). School equity since Gonski: how bad became worse. http://needtosucceed.org/equity-in-australian-schooling-an-update/
[3] Some caution in interpreting the data in Figure 1 is required because of the way in which ICSEA was constructed with reference to NAPLAN results.
[4] Sahlberg, P (2007). Education policies for raising student learning: The Finnish approach. Journal of Education Policy, 22(2), 147-171.
[5] Organisation for Economic Cooperation and Development (2013). PISA 2012 Results – Excellence through Equity: giving every student the chance to succeed (Volume II), PISA, OECD Publishing.
[6] Masters, G (2012). National School Improvement Tool. Melbourne: Australian Council for Educational Research. www.acer.edu.au/files/NSIT.pdf